How Bézier Curves Work: de Casteljau's Algorithm in Dart
quadraticBezierTo and cubicTo draw a smooth curve from a handful of points, most of which the curve never touches. That's fine until you need something the Path API doesn't offer: the exact point halfway along a curve, a curve cut in two, a control point that makes the curve pass through a given spot, or a quadratic rewritten as a cubic.
All of those come from one small idea, repeated linear interpolation. This article builds it up step by step and turns each step into Dart you can test. If you want the Path API itself (quadraticBezierTo, cubicTo, smooth chart lines), see the Flutter Bézier curves guide first.
Step 1: a point on a straight line
Linear interpolation, or lerp, finds the point a fraction t of the way from a to b:
Offset lerp(Offset a, Offset b, double t) => a + (b - a) * t;
At t = 0 you get a, at t = 1 you get b, and at t = 0.5 you get the midpoint. As t runs from 0 to 1 the point slides along the segment. That moving point is a degree-1 Bézier curve: a straight line.
Flutter has Offset.lerp too, but it takes and returns nullable offsets (Offset?), so every call would need a !. For geometry the one-liner above is simpler.
Step 2: lerp the lerps (de Casteljau)
Now take three points, P0, P1 and P2. Pick a t, then:
- Lerp along P0→P1 and along P1→P2. You now have two points.
- Lerp between those two points with the same
t. You have one point.
That final point is on the quadratic Bézier curve. Sweep t from 0 to 1 and it traces the whole curve. With four points you do one extra round (4 → 3 → 2 → 1) and get a cubic. This is de Casteljau's algorithm, and it works for any number of points:
/// One round of de Casteljau: n points in, n - 1 points out.
List<Offset> reduce(List<Offset> points, double t) => [
  for (var i = 0; i < points.length - 1; i++) lerp(points[i], points[i + 1], t),
];

/// The point at [t] on a Bézier curve of any degree:
/// 2 points = line, 3 = quadratic, 4 = cubic.
Offset evaluate(List<Offset> points, double t) {
  var level = points;
  while (level.length > 1) {
    level = reduce(level, t);
  }
  return level.single;
}
evaluate(points, t) is the function Flutter's Path doesn't expose. PathMetric.getTangentForOffset gives you a point at a distance along a path, which is a different thing, as you'll see below.
Seeing the construction
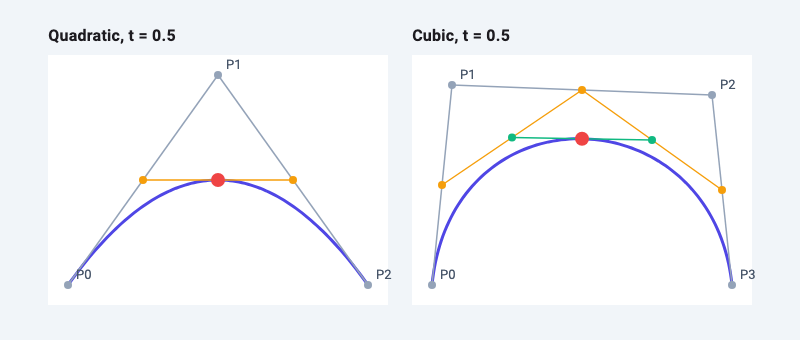
This painter draws the curve by sampling evaluate, then draws each round of the construction at a given t. Grey is the control polygon, then each colour is one more round of reduce, and the red dot is the result.
class DeCasteljauPainter extends CustomPainter {
  DeCasteljauPainter(
    this.points,
    this.t, {
    this.labelStyle = const TextStyle(color: Color(0xFF475569), fontSize: 13),
  });

  final List<Offset> points;
  final double t;
  final TextStyle labelStyle;

  static const _levelColors = [
    Color(0xFF94A3B8), // control polygon
    Color(0xFFF59E0B),
    Color(0xFF10B981),
    Color(0xFFEC4899),
  ];

  @override
  void paint(Canvas canvas, Size size) {
    // The curve, sampled with evaluate(). Works for any degree.
    final curve = Path()..moveTo(points.first.dx, points.first.dy);
    for (var i = 1; i <= 100; i++) {
      final p = evaluate(points, i / 100);
      curve.lineTo(p.dx, p.dy);
    }
    canvas.drawPath(
      curve,
      Paint()
        ..style = PaintingStyle.stroke
        ..strokeWidth = 3
        ..color = const Color(0xFF4F46E5),
    );

    // Each round of de Casteljau: connect the points, then interpolate again.
    var level = points;
    var depth = 0;
    while (level.length > 1) {
      final color = _levelColors[depth % _levelColors.length];
      final line = Paint()
        ..strokeWidth = 1.5
        ..color = color;
      for (var i = 0; i < level.length - 1; i++) {
        canvas.drawLine(level[i], level[i + 1], line);
      }
      for (final p in level) {
        canvas.drawCircle(p, 4, Paint()..color = color);
      }
      level = reduce(level, t);
      depth++;
    }
    canvas.drawCircle(level.single, 7, Paint()..color = const Color(0xFFEF4444));

    for (var i = 0; i < points.length; i++) {
      final label = TextPainter(
        text: TextSpan(text: 'P$i', style: labelStyle),
        textDirection: TextDirection.ltr,
      )..layout();
      label.paint(canvas, points[i] + const Offset(8, -18));
      label.dispose();
    }
  }

  @override
  bool shouldRepaint(DeCasteljauPainter oldDelegate) =>
      oldDelegate.t != t ||
      oldDelegate.points != points ||
      oldDelegate.labelStyle != labelStyle;
}
Put it in a fixed-size box (a CustomPaint with no child defaults to zero size) and drive t from a slider or an AnimationController to watch the construction slide along the curve.
Step 3: the formulas
Expanding the nested lerps for three points gives the quadratic formula:
B(t) = (1 − t)² P0 + 2(1 − t)t P1 + t² P2
and for four points, the cubic:
B(t) = (1 − t)³ P0 + 3(1 − t)²t P1 + 3(1 − t)t² P2 + t³ P3
Offset quadraticAt(Offset p0, Offset p1, Offset p2, double t) {
  final u = 1 - t;
  return p0 * (u * u) + p1 * (2 * u * t) + p2 * (t * t);
}

Offset cubicAt(Offset p0, Offset p1, Offset p2, Offset p3, double t) {
  final u = 1 - t;
  return p0 * (u * u * u) +
      p1 * (3 * u * u * t) +
      p2 * (3 * u * t * t) +
      p3 * (t * t * t);
}
The multipliers are called Bernstein polynomials. A unit test that compares these against evaluate at 1,001 values of t finds them identical to within 1e-9, as expected: they are the same calculation written two ways. The closed form avoids building intermediate lists; de Casteljau works for any degree and, as you'll see, gives you curve splitting for free.
Does Flutter draw the same curve? A test that builds a Path with cubicTo, samples it densely with PathMetric, and measures how far each evaluate point is from that sampled outline found a worst case of 0.00004 px across three test curves. Same maths.
Two properties fall straight out of the formulas:
- The weights always add up to 1. Every point on the curve is a weighted average of the control points, so the curve stays inside their convex hull (the shape you'd get by stretching a rubber band around them).
- At
t = 0only P0 has weight, att = 1only the last point does. That's why the curve starts and ends exactly on its end points.
Why the curve doesn't pass through its control points
The inner control points never get a weight of 1. Their largest weights are:
| Curve | Control point | Largest weight | At |
|---|---|---|---|
| Quadratic | P1 | 1/2 | t = 0.5 |
| Cubic | P1 | 4/9 ≈ 0.44 | t = 1/3 |
| Cubic | P2 | 4/9 ≈ 0.44 | t = 2/3 |
So the curve is pulled towards each control point but never more than about half of the way. It only touches one in special layouts, such as all points lying on one line. This has practical consequences when you place points by hand.
A quadratic peaks halfway to its control point
At t = 0.5 the weights are 1/4, 1/2, 1/4, which works out to the midpoint between the control point and the midpoint of P0–P2. If your curve should rise 50 px above its end points, the control point has to sit 100 px above them.
Turn that around and you can make a quadratic pass through any point m at t = 0.5:
/// The control point that makes a quadratic from p0 to p2 pass through m at t = 0.5.
Offset controlThrough(Offset p0, Offset m, Offset p2) => m * 2 - (p0 + p2) / 2;
That answers the common question of how to draw a curve through three given points.
A cubic bump reaches three quarters of the way
For a symmetric cubic with both control points at height h above the end points, t = 0.5 gives weights 1/8, 3/8, 3/8, 1/8, so the peak is at 0.75 h. To reach a height of 60, put the control points at 80.
The same reasoning produces the well-known constant for approximating a circle with cubics. For a quarter circle of radius 1 from (1, 0) to (0, 1), placing the control points at distance κ = 4(√2 − 1)/3 ≈ 0.5523 along the tangents puts the midpoint exactly on the circle. A test that samples 10,001 points along that curve finds a largest radial error of 0.00027, or 0.027% of the radius.
The end tangents point at the neighbouring control points
The derivative of a Bézier curve is another Bézier curve, one degree lower, built from the differences between neighbouring points:
/// The derivative of a Bézier curve is a Bézier curve one degree lower.
List<Offset> derivative(List<Offset> points) {
  final n = points.length - 1;
  return [for (var i = 0; i < n; i++) (points[i + 1] - points[i]) * n.toDouble()];
}
At t = 0 that's 3 × (P1 − P0) for a cubic: the curve leaves P0 heading straight at P1, and arrives at P3 coming from the direction of P2. This is why two curves join smoothly when the control points on either side of the shared point lie on one line, and why design tools show a smooth anchor's two handles as one straight bar.
Splitting a curve at t
Look at the construction picture again. The points on the left edge of each round (P0, the first orange point, the first green point, the red point) are the control points of the part of the curve before t. The points on the right edge, read backwards, are the control points of the part after it. Both halves have the same degree as the original:
/// Splits a curve at [t] into two curves of the same degree.
(List<Offset>, List<Offset>) split(List<Offset> points, double t) {
  final left = <Offset>[];
  final right = <Offset>[];
  var level = points;
  while (level.isNotEmpty) {
    left.add(level.first);
    right.insert(0, level.last);
    level = reduce(level, t);
  }
  return (left, right);
}
A test splits a cubic at t = 0.3, 0.5 and 0.8 and checks that left at parameter s equals the original at s × t, and right at s equals the original at t + s × (1 − t). They match to within 1e-9, so the two halves are exactly the original curve, not an approximation.
You need this for trimming a curve, inserting an anchor point into a path in an editor without changing its shape, or drawing a curve "growing" from its start by drawing only the left half.
t is not distance along the curve
For that last use, be careful: t = 0.5 is not halfway along the curve. Splitting the lopsided cubic (0, 0), (10, 120), (40, 140), (300, 0) at t = 0.5 and measuring both halves with PathMetric shows the first half is only 32% of the total length. The parameter moves fast where control points are far apart and slowly where they bunch up.
When you need even speed, such as an object moving along a path at constant velocity or a line drawing itself evenly, measure by length instead. Animating path drawing with PathMetric covers that.
Converting a quadratic to a cubic (the 2/3 rule)
When you want every segment as a cubic, for example to morph one path into another segment by segment, any quadratic can be rewritten as a cubic that traces exactly the same curve:
/// The exact cubic that traces the same curve as a quadratic.
List<Offset> quadraticToCubic(Offset p0, Offset c, Offset p2) => [
  p0,
  p0 + (c - p0) * (2 / 3),
  p2 + (c - p2) * (2 / 3),
  p2,
];
Each new control point sits two thirds of the way from an end point to the old control point. The 2/3 comes from the tangents: a quadratic's start tangent is 2 × (C − P0) and a cubic's is 3 × (C1 − P0), so C1 = P0 + 2/3 × (C − P0).
A test compares the two curves at 1,001 values of t: the largest difference is about 1e-13 px, which is floating-point noise. Using 1/2 instead of 2/3, a common guess, puts the curve 26 px off for the same 300 px wide example. Going the other way is generally not exact. A quadratic is always a piece of a parabola, which can't make the S-bend a cubic can, so cubic-to-quadratic converters split the cubic into pieces and approximate each one.
Quick reference
| Task | How |
|---|---|
Point at parameter t |
evaluate(points, t), or the Bernstein formula |
| Point at a distance along the curve | PathMetric.getTangentForOffset(distance) |
| Cut a curve in two | split(points, t), the edges of the de Casteljau triangle |
Quadratic through point m at t = 0.5 |
control = 2m − (P0 + P2) / 2 |
Symmetric cubic bump of height h |
control points at 4h / 3 |
| Quarter circle with a cubic | handles of length 0.5523 × radius |
| Quadratic as a cubic | control points at 2/3 of the way to the old control point |
| Smooth join between two curves | handles on each side of the anchor on one straight line |
All of these are a few lines of Dart with no packages, and because they only use Offset arithmetic you can unit-test them without rendering anything.
Related articles
Explore Our Projects
Beyond the shape tools — two more things we build and use every day. Free to try, no signup.
Keyboard Arena
Typing practice that plays like a game
Real-time WPM tests, mechanical switch audio, A-Z finger drills and 40+ structured lessons. Race a ghost of your best run instead of grinding random words.
- ✓ Live WPM & Accuracy
- ✓ Mechanical Switch Audio
- ✓ 40+ Guided Lessons
Flutter Log Explorer
Finally, Flutter logs you can read
Zero-config, real-time log capture from the Debug Adapter and Dart VM Service, with smart classification, filters and deduplication — all inside VS Code.
- ✓ Zero-Config Capture
- ✓ Smart Filters & Search
- ✓ Noise-Free Deduplication
Ready to Design Your Own Shapes?
Open the editor and start creating professional Flutter CustomPainter code visually.
Open the Editor