fl_chart vs Syncfusion vs graphic: Flutter Chart Packages Compared
Three Flutter chart packages come up again and again: fl_chart, syncfusion_flutter_charts and graphic. They solve the same problem with very different APIs and very different licences.
To compare them fairly, this article builds the same line chart, eight months of sales from one list, with each package, and then once more with a plain CustomPainter. All four were rendered in widget tests with the same line colour and the same 0 to 40 y range.
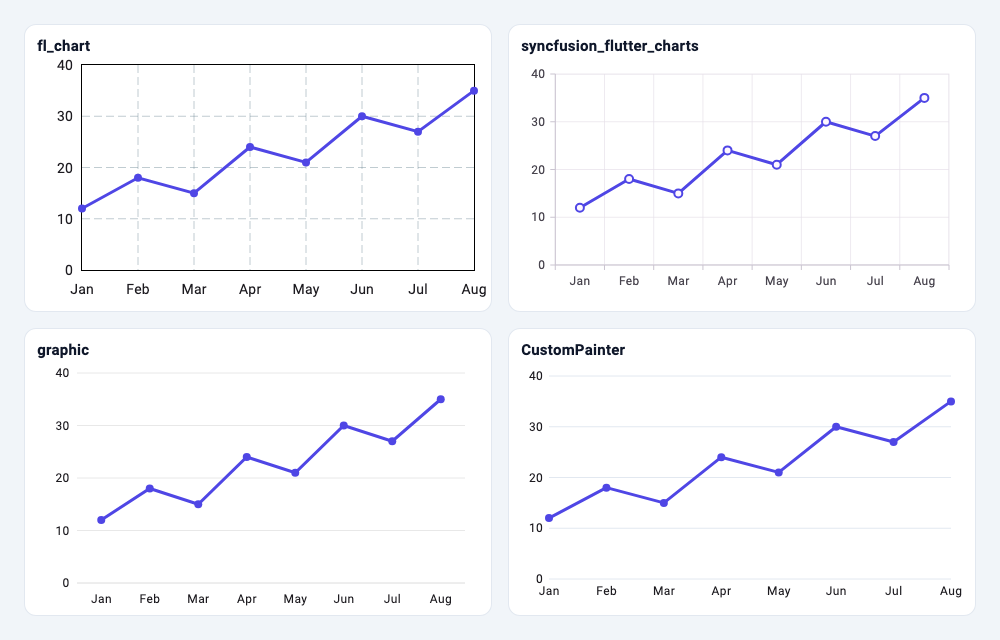
Versions used: fl_chart 1.3.0, syncfusion_flutter_charts 35.1.43 and graphic 2.7.0, which were the latest releases on pub.dev as of November 2026, on Flutter 3.38.7.
Quick answer
| fl_chart | syncfusion_flutter_charts | graphic | CustomPainter | |
|---|---|---|---|---|
| API style | One big data object per chart | Widgets plus series and behaviour objects | Grammar of graphics | Canvas calls |
| Chart types | Line, bar, pie, scatter, radar, candlestick, gauge | 30+ cartesian and circular types | Any combination of marks and coordinates | Whatever you draw |
| Tooltips | Built in, on touch | Built in, on tap | Built in, via selections | Write your own |
| Zoom and pan | Opt-in (transformationConfig) |
Opt-in (ZoomPanBehavior) |
Opt-in (range updaters) | Write your own |
| Licence | MIT | Commercial or free Community Licence | MIT | Yours |
If the licence fits, Syncfusion offers more chart types and built-in interactions than the other two. fl_chart is a common free choice for standard charts. graphic suits charts that don't fit a fixed list of types. A CustomPainter wins when the chart is small, fixed and has to match a design exactly.
The shared data
class Sale {
  const Sale(this.month, this.value);
  final String month;
  final double value;
}

const sales = [
  Sale('Jan', 12),
  Sale('Feb', 18),
  Sale('Mar', 15),
  Sale('Apr', 24),
  Sale('May', 21),
  Sale('Jun', 30),
  Sale('Jul', 27),
  Sale('Aug', 35),
];

const lineColor = Color(0xFF4F46E5);
fl_chart
class FlLineChart extends StatelessWidget {
  const FlLineChart({super.key});

  @override
  Widget build(BuildContext context) {
    return LineChart(
      LineChartData(
        minY: 0,
        maxY: 40,
        lineBarsData: [
          LineChartBarData(
            spots: [
              for (var i = 0; i < sales.length; i++)
                FlSpot(i.toDouble(), sales[i].value),
            ],
            color: lineColor,
            barWidth: 3,
            dotData: const FlDotData(show: true),
          ),
        ],
        titlesData: FlTitlesData(
          topTitles: const AxisTitles(),
          rightTitles: const AxisTitles(),
          bottomTitles: AxisTitles(
            sideTitles: SideTitles(
              showTitles: true,
              interval: 1,
              reservedSize: 28,
              getTitlesWidget: (value, meta) => SideTitleWidget(
                meta: meta,
                child: Text(sales[value.toInt()].month),
              ),
            ),
          ),
        ),
        lineTouchData: const LineTouchData(enabled: true), // tooltips (default)
      ),
    );
  }
}
How it thinks. Everything is described by one immutable LineChartData tree. X values are numbers, so categories like month names are indexes plus a getTitlesWidget callback that turns each index back into a label. Titles are ordinary widgets, so they pick up your text theme.
Defaults to know about. Axis titles appear on all four sides until you switch off topTitles and rightTitles, and the default grid and border are drawn, which is why the fl_chart panel looks busier than the others. The first and last points sit on the chart edges. When the data changes, the chart animates to the new values over 150 ms by default (duration and curve on LineChart).
Interactivity. Touch tooltips are on by default and show while a finger is down. Zoom and pan are opt-in:
LineChart(
  LineChartData(
    lineBarsData: [
      LineChartBarData(
        spots: [
          for (var i = 0; i < sales.length; i++)
            FlSpot(i.toDouble(), sales[i].value),
        ],
      ),
    ],
  ),
  transformationConfig: const FlTransformationConfig(
    scaleAxis: FlScaleAxis.horizontal,
    maxScale: 4,
  ),
);
scaleAxis defaults to FlScaleAxis.none, so nothing zooms until you set it.
syncfusion_flutter_charts
class _SfLineChartState extends State<SfLineChart> {
  late final TooltipBehavior _tooltip = TooltipBehavior(enable: true);
  late final ZoomPanBehavior _zoomPan = ZoomPanBehavior(
    enablePinching: true,
    enablePanning: true,
    zoomMode: ZoomMode.x,
  );

  @override
  Widget build(BuildContext context) {
    return SfCartesianChart(
      primaryXAxis: const CategoryAxis(),
      primaryYAxis: const NumericAxis(minimum: 0, maximum: 40),
      tooltipBehavior: _tooltip,
      zoomPanBehavior: _zoomPan,
      series: <CartesianSeries<Sale, String>>[
        LineSeries<Sale, String>(
          dataSource: sales,
          xValueMapper: (sale, _) => sale.month,
          yValueMapper: (sale, _) => sale.value,
          color: lineColor,
          width: 3,
          markerSettings: const MarkerSettings(isVisible: true),
          name: 'Sales',
        ),
      ],
    );
  }
}
How it thinks. You pass your own objects as dataSource and map them with xValueMapper and yValueMapper, so there's no conversion step. A CategoryAxis takes the month strings directly. Behaviours such as tooltips, zooming, trackball and crosshair are separate objects; the state class holds them so they survive rebuilds, the same pattern Syncfusion's examples use.
Defaults to know about. Series animate in on first build (animationDuration defaults to 1,500 ms). Category labels are centred in their slots, so the line doesn't touch the edges. Axis labels are styled from the app's Theme text styles.
Interactivity. More built-in options than the other two: tooltip, trackball, crosshair, selection, and zooming by pinch, double tap, selection rectangle or mouse wheel. Each is opt-in; for example every enable... flag on ZoomPanBehavior defaults to false. A tooltip appears on a single tap and hides after 3 seconds by default.
graphic
class GraphicLineChart extends StatelessWidget {
  const GraphicLineChart({super.key});

  @override
  Widget build(BuildContext context) {
    // graphic paints its own labels, so pass the app's text style in.
    final labels = Theme.of(context).textTheme.bodySmall!;
    return g.Chart<Sale>(
      data: sales,
      variables: {
        'month': g.Variable(accessor: (Sale s) => s.month),
        'value': g.Variable(
          accessor: (Sale s) => s.value,
          scale: g.LinearScale(
            min: 0,
            max: 40,
            formatter: (v) => v.toStringAsFixed(0),
          ),
        ),
      },
      marks: [
        g.LineMark(
          color: g.ColorEncode(value: lineColor),
          size: g.SizeEncode(value: 3),
        ),
        g.PointMark(
          color: g.ColorEncode(value: lineColor),
          size: g.SizeEncode(value: 8),
        ),
      ],
      axes: [
        g.AxisGuide(
          line: g.Defaults.strokeStyle,
          label: g.LabelStyle(textStyle: labels, offset: const Offset(0, 7.5)),
        ),
        g.AxisGuide(
          label: g.LabelStyle(textStyle: labels, offset: const Offset(-7.5, 0)),
          grid: g.Defaults.strokeStyle,
        ),
      ],
      selections: {'tap': g.PointSelection(dim: g.Dim.x)},
      tooltip: g.TooltipGuide(textStyle: labels),
      crosshair: g.CrosshairGuide(),
      coord: g.RectCoord(
        horizontalRangeUpdater: g.Defaults.horizontalRangeEvent,
      ),
    );
  }
}
The import is prefixed (import 'package:graphic/graphic.dart' as g;) because graphic exports short names such as Chart, Variable and Scale that are easy to clash with.
How it thinks. graphic follows the grammar of graphics from Leland Wilkinson's book of that name. You declare variables, then marks (line, point, interval, area and so on) that encode those variables, then a coordinate system. There is no "line chart" class: a line chart is a LineMark in a RectCoord. Swap the LineMark for an IntervalMark and the same data becomes a bar chart; put the line in a PolarCoord and it wraps around a circle.
Defaults to know about. Labels are drawn with the package's own Defaults.textStyle (10 px, no font family), so they don't follow your theme unless you pass a style, as above. Marks animate only when you configure their transition or entrance.
Interactivity. Interaction is described as named selections (tap, hover, long press, scale gestures) that tooltips, crosshairs and colour updaters react to. The horizontalRangeUpdater line enables pinch-zoom and pan on the x axis.
Tooltips side by side
The same widget test layout, after touching the May point in each chart:
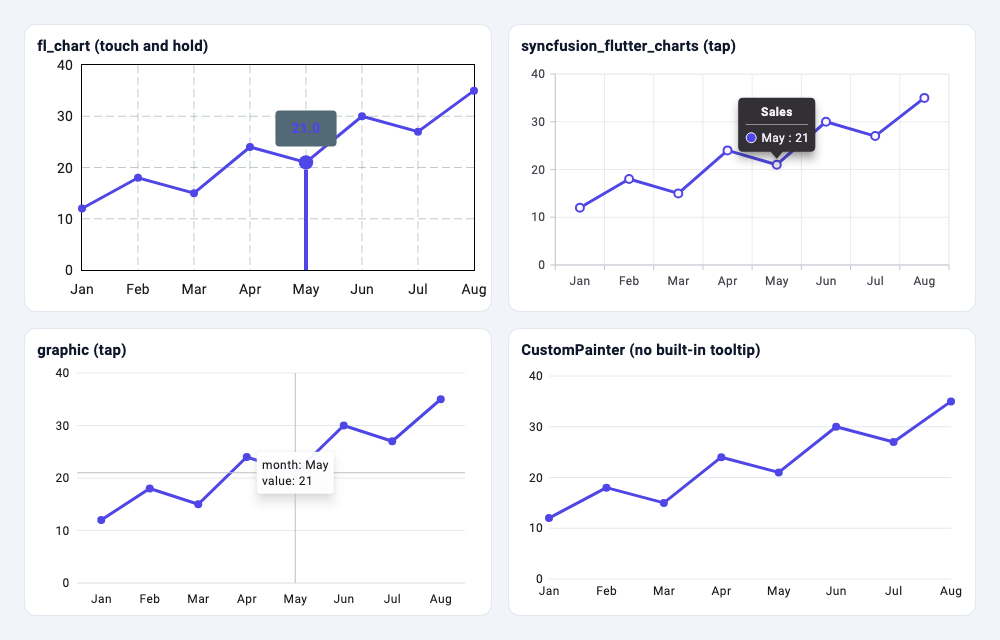
All three packages produce a usable tooltip with no extra code beyond what is shown above. Their look is customisable: LineTouchTooltipData in fl_chart, TooltipBehavior properties and builders in Syncfusion, and TooltipGuide in graphic.
Or write it yourself with CustomPainter
A static line chart is about 70 lines of painting code:
class LineChartPainter extends CustomPainter {
  LineChartPainter(
    this.data, {
    required this.labelStyle,
    this.color = lineColor,
    this.maxY = 40,
  });

  final List<Sale> data;
  final TextStyle labelStyle;
  final Color color;
  final double maxY;

  @override
  void paint(Canvas canvas, Size size) {
    const left = 28.0, bottom = 24.0, top = 8.0;
    final chart = Rect.fromLTRB(
      left,
      top,
      size.width - 8,
      size.height - bottom,
    );

    Offset point(int i, double v) => Offset(
      chart.left + chart.width * i / (data.length - 1),
      chart.bottom - chart.height * v / maxY,
    );

    void label(String text, Offset anchor, {bool alignRight = false}) {
      final tp = TextPainter(
        text: TextSpan(text: text, style: labelStyle),
        textDirection: TextDirection.ltr,
      )..layout();
      final dx = alignRight ? anchor.dx - tp.width : anchor.dx - tp.width / 2;
      tp.paint(canvas, Offset(dx, anchor.dy - tp.height / 2));
      tp.dispose();
    }

    // Horizontal grid lines and y labels.
    final grid = Paint()..color = const Color(0xFFE2E8F0);
    for (var v = 0.0; v <= maxY; v += 10) {
      final y = point(0, v).dy;
      canvas.drawLine(Offset(chart.left, y), Offset(chart.right, y), grid);
      label(v.toInt().toString(), Offset(chart.left - 6, y), alignRight: true);
    }

    // The line, then a dot and an x label per data point.
    final line = Path();
    for (var i = 0; i < data.length; i++) {
      final p = point(i, data[i].value);
      i == 0 ? line.moveTo(p.dx, p.dy) : line.lineTo(p.dx, p.dy);
      label(data[i].month, Offset(p.dx, chart.bottom + 12));
    }
    canvas.drawPath(
      line,
      Paint()
        ..color = color
        ..style = PaintingStyle.stroke
        ..strokeWidth = 3
        ..strokeJoin = StrokeJoin.round,
    );
    for (var i = 0; i < data.length; i++) {
      canvas.drawCircle(point(i, data[i].value), 4, Paint()..color = color);
    }
  }

  @override
  bool shouldRepaint(LineChartPainter oldDelegate) =>
      oldDelegate.data != data ||
      oldDelegate.labelStyle != labelStyle ||
      oldDelegate.color != color ||
      oldDelegate.maxY != maxY;
}
Pass the text style in from the widget that creates the painter. A TextPainter doesn't inherit DefaultTextStyle, so a hard-coded TextStyle won't pick up the font or colours from your app's theme:
CustomPaint(
  size: const Size(double.infinity, 220),
  painter: LineChartPainter(
    sales,
    // TextPainter does not inherit DefaultTextStyle: pass a style in.
    labelStyle: Theme.of(context).textTheme.bodySmall!,
  ),
);
This is worth it for sparklines, a progress chart on a dashboard card, or a chart a designer has drawn pixel by pixel. It stops being worth it once you need tooltips, axis auto-ranging, legends, zoom or accessibility, which the packages already handle. To smooth the line, swap lineTo for cubicTo; the Bezier curves guide shows how.
Licences
- fl_chart and graphic are MIT licensed. Use them in any project, commercial or not, keeping the copyright notice.
- syncfusion_flutter_charts is a commercial package. The README states that you need either a Syncfusion commercial licence or the free Community Licence to use it. As of November 2026, the Community Licence page lists these conditions: less than $1 million USD annual gross revenue, 5 or fewer developers and 10 or fewer total employees, never more than $3 million USD of outside capital, and no government-funded organisations. The
LICENSEfile shipped in version 35.1.43 words the developer limit as "less than five (5) developers", so read the current terms before relying on it.
There is no licence key to register in code for the Flutter package; the licence is a legal condition rather than a runtime check. pub.dev tags the package's licence as "unknown", since it isn't an OSI-approved licence.
Dependencies and maintenance
From each package's pubspec and pub.dev page, as of November 2026:
| fl_chart | syncfusion_flutter_charts | graphic | |
|---|---|---|---|
| Latest version (date) | 1.3.0 (Oct 21, 2026) | 35.1.43 (Nov 3, 2026) | 2.7.0 (Feb 25, 2026) |
| Verified publisher | flchart.dev | syncfusion.com | None |
| Likes | 7,204 | 3,642 | 904 |
| Pub points | 160 / 160 | 150 / 160 | 160 / 160 |
| Downloads (last 30 days) | 2.33 million | 266,000 | 42,000 |
| Direct dependencies | equatable, vector_math |
syncfusion_flutter_core, intl, vector_math |
collection, vector_math, path_drawing |
| Minimum Flutter | 3.27.4 | 3.35.1 | 3.16.0 |
What the release history says:
- fl_chart ships a feature release every few months; 1.3.0 added a gauge chart.
- syncfusion_flutter_charts publishes roughly weekly (six releases between October 7 and November 3, 2026), with version numbers tied to Syncfusion's Essential Studio releases. It also has the highest minimum Flutter version of the three (3.35.1).
- graphic's 2.7.0 added a coding-agent skill file; the previous feature release was 2.6.0 in June 2025. It works, but changes arrive slowly.
Which one should you choose?
- Standard charts, free licence, wide community?
fl_chart. Expect to spend some lines on titles and touch styling. - Many chart types, trackball, selection zooming, live updates, and you qualify for the Community Licence or have a commercial one?
syncfusion_flutter_charts. - Unusual charts, or you think in terms of data encodings rather than chart types?
graphic. - One small chart with a fixed look and no interaction? A
CustomPainter, with no dependency at all.
Related articles
Explore Our Projects
Beyond the shape tools — two more things we build and use every day. Free to try, no signup.
Keyboard Arena
Typing practice that plays like a game
Real-time WPM tests, mechanical switch audio, A-Z finger drills and 40+ structured lessons. Race a ghost of your best run instead of grinding random words.
- ✓ Live WPM & Accuracy
- ✓ Mechanical Switch Audio
- ✓ 40+ Guided Lessons
Flutter Log Explorer
Finally, Flutter logs you can read
Zero-config, real-time log capture from the Debug Adapter and Dart VM Service, with smart classification, filters and deduplication — all inside VS Code.
- ✓ Zero-Config Capture
- ✓ Smart Filters & Search
- ✓ Noise-Free Deduplication
Ready to Design Your Own Shapes?
Open the editor and start creating professional Flutter CustomPainter code visually.
Open the Editor